Drupal 9: Troubleshooting Cache API issues, Part 1: Xdebug, wodby/drupal, VS Code
In my 30+ years of programming, my go-to debugging tool has been the judicious usage of print commands on the appropriate variables at the appropriate times. Of course, print takes many different forms depending on the technology stack and the application model, but the principle remains the same. In very few cases did this approach fail me, and I stumbled across one such case as I was debugging the notoriously tricky Drupal Cache API. In a nutshell, there was one module, among the dozens of core, contrib and custom modules making up that particular site, that was invalidating the static page cache and preventing pages from being cached. I wanted to find which module was the culprit.
The problem with this issue is that the Cache API is called thousands of times per request - for pretty much every theming function participating in a page render. Further, the caching logic is complex as it involves combinations of cache tags, max-age settings, and various other mechanisms that affect the decisions of which caching tables to use and which caching headers to return in the HTTP response.
Trying to pinpoint the particular condition that caused the cache invalidation in this case using print statements would have been an inefficient and tedious process, and the client wouldn’t have liked to pay for that inefficiency. Kind of like the game of 20 questions, but with incomplete information and many, many decision bracnhes. So I decided to bite the bullet and set up my Xdebug environment to catch the bug red-handed, so to speak. With its pants down, so to speak. To catch it in the act, so to speak.
Here’s a high level diagram of the various components at play here. I slightly modified it from the original at this other tutorial on the same topic.
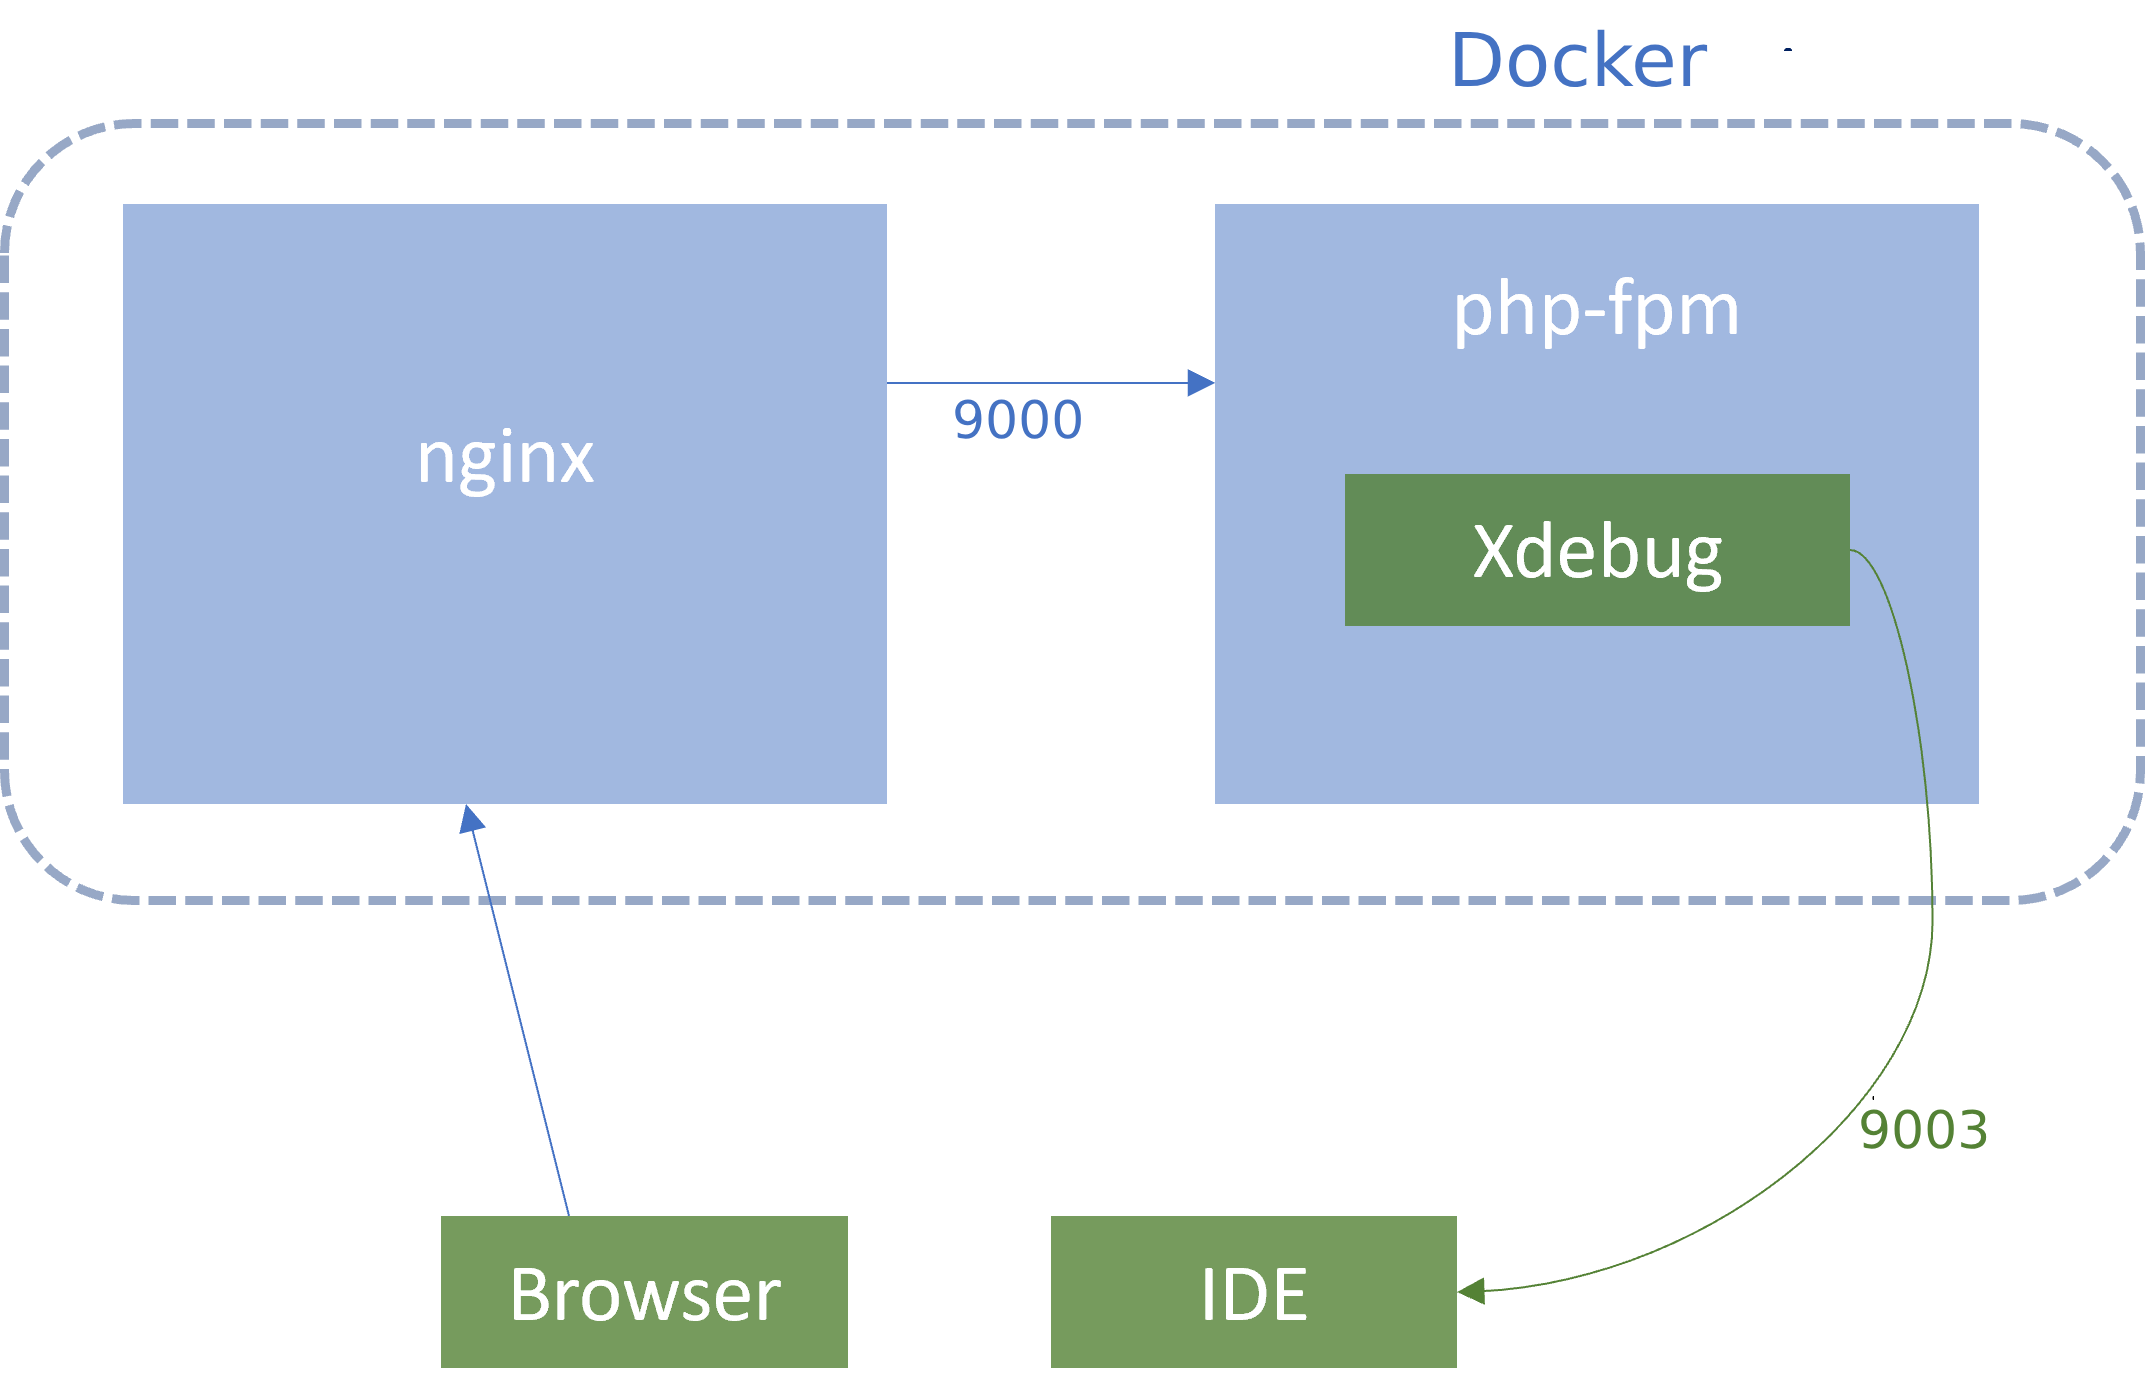
My development environment is made up of the excellent Docker-based Drupal stack by Wodby. I can’t say enough good things about this framework, which has allowed me to start new Drupal projects, and even adopt legacy ones, on a solid footing without breaking a sweat. The architecture is simple, documentation is clear, customization is easy. I’ve been able to share development environments with team members using macOS and Windows systems with minimal changes.
The wodby/drupal-php image comes loaded with the Xdebug extension, and it’s “only” necessary to configure the right environment variables to activate it. I say “only” because many of the settings are non-obvious and required some experimentation before I could get them running, in addition to a VS Code configuration to match.
Here’s my current setup, in the main docker-compose.yml file running the full Drupal stack:
services:
  php:
    image: wodby/drupal-php:$PHP_TAG
    environment:
      PHP_XDEBUG: 1
      PHP_XDEBUG_MODE: debug
      PHP_XDEBUG_START_WITH_REQUEST: yes
      PHP_XDEBUG_CLIENT_HOST: host.docker.internal
      PHP_XDEBUG_LOG: /tmp/php-xdebug.log
    extra_hosts:
      - "host.docker.internal:host-gateway"
Here’s what the non-obvious settings mean:
-
PHP_XDEBUG_MODE: debugenables Xdebug step debugging, which is our purpose here. -
PHP_XDEBUG_START_WITH_REQUEST: yesmeans that Xdebug is activated at every request, automatically. -
PHP_XDEBUG_CLIENT_HOST: host.docker.internalis the all-important address of the machine running the debugging client - in my case, VS Code on my local machine. According to documentation, the namehost.docker.internalis automatically available in Docker 18.03+ Mac/Win, but not on Linux. For Linux, we add the stanzaextra_hosts: "host.docker.internal:host-gateway"which maps that domain name to Docker’s gateway IP, which is the Docker host, which is my laptop OS running VS Code
But that’s only half of the story. The other half is convincing VS Code to act as a debugging client to Xdebug. To do that, we use the PHP Debug VS Code extension and we customize the Launch configurations to add the Xdebug endpoint. Basically, we create a .vscode/launch.json file in the project root with the following content:
{
  "version": "0.2.0",
  "configurations": [
   {
      "name": "Listen for Xdebug",
      "type": "php",
      "request": "launch",
      "port": 9003,
      "pathMappings": {
        "/var/www/html/": "${workspaceFolder}/src"
      }
    }
  ]
}
Here’s what the non-obvious settings mean:
-
"port": 9003is the default port that Xdebug hits on the client, and that’s where VS Code should be listening for debug events. -
"pathMappings": { "/var/www/html/": "${workspaceFolder}/src" }maps the Docker filesystem path/var/www/htmlwhere the app resides to the actual host path"${workspaceFolder}/src"where${workspaceFolder}is a VS Code variable.
With these in place, it should be now possible to place a breakpoint in, say, src/web/index.php (the Drupal main entrypoint) and catch every request! Select Run > Start Debugging or or click the Listen for Xdebug configuration in the bottom status bar. We are finally ready to start debugging the Drupal Cache API ![]()
Troubleshooting
Of course, this setup didn’t come by without many failures and much head-scratching, perhaps even some teeth-clenching. If your 100% guaranteed breakpoint (like one in src/web/index.php) is not being hit, then it’s time to put on your sleuthing hat ![]()
Check that the Xdebug log is active and connected. Running docker-compose exec php tail -f /tmp/php-xdebug.log should show messages like:
[112] Log opened at 2023-10-25 06:42:12.885888
[112] [Step Debug] INFO: Connecting to configured address/port: host.docker.internal:9003.
[112] [Step Debug] INFO: Connected to debugging client: host.docker.internal:9003 (through xdebug.client_host/xdebug.client_port). :-)
Yes, that final smiley is part of the log :-)
If instead, you see a sad smiley message like:
112] [Step Debug] ERR: Could not connect to debugging client. Tried: host.docker.internal:9003 (through xdebug.client_host/xdebug.client_port) :-(
Then check that a connection can be established between Xdebug and VS Code. Running docker-compose exec php nc -zv host.docker.internal 9003 should return a successful response like:
host.docker.internal (172.17.0.1:9003) open
Anything else is a sign that the Docker container is unable to connect to the host on port 9003. Check your host.docker.internal name resolution, check the launch.json port setting, turn it off and on again, talk to your rubber duck - you know the drill!